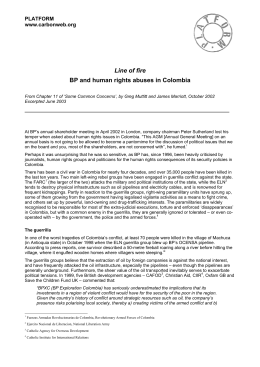
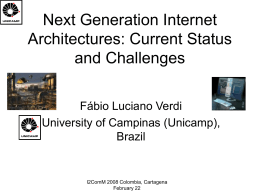
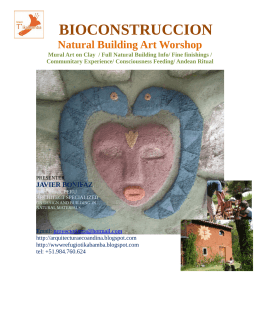
United Nations
Educational, Scientific and
Cultural Organization
One of the major reforms since 2000 is the
policy where every child must go to school.
This has assisted every person to taste the
fruits of education. It may have robbed the
farmers of their labour force, but it has given
them the seeds for a better life in the future.
– Sonam, teacher in Bhutan
Parents that have faced the hardships of not
being able to write letters, use mobile phones
or ATMs do all they can to provide their children
with an education so they don’t ever become
excluded due to illiteracy.
– Omovigho Rani Ebireri,
University of Maiduguri, Nigeria
I left because of the things that were happening,
with the rebels. They destroyed our school, we
couldn’t go any more. They didn’t like the way
some of the girls were dressed. They yelled at
us, saying that what we were wearing wasn’t
good. They broke our school desks, destroyed
our school books and our things. School is
supposed to be a place where we learn things.
– Sita, student in Nigeria
Every child under 5 has to attend pre-school.
Early childhood education is a major priority.
– Martha Isabel Castano,
Primary school teacher, Colombia
achievements and challenges
1. See Table 2 for countries and territories in this EFA region.
The EFA Global Monitoring Report is an editorially independent, evidence-based publication that
serves as an indispensable tool for governments, researchers, education and development
specialists, media and students. It has assessed education progress in some 200 countries
and territories on an almost annual basis since 2002. This work will continue, throughout the
implementation of the post-2015 sustainable development agenda, as the Global Education
Monitoring Report.
Education for all 2000-2015:
However, the successful implementation
of policies such as cash transfers, which
increased in coverage from 5.7% in 2000
to 19.3% in 2010, is not enough to address
persistent geographic, socio-economic
and ethnic disparities. In 2012, the region
was still home to nearly 4 million out-ofschool children of primary school age; boys’
underparticipation in secondary education
has remained high; and 33 million adults,
55% of whom are women, lacked basic
literacy skills. These must be redressed
as the world is defining a new education
agenda – for children, youth and adults
to benefit equally from the opportunities
education provides, regardless of the
circumstances they were born or live in.
0
1
Education for All 2000–2015: Achievements and Challenges provides a comprehensive assessment
of country progress towards the EFA goals and highlights the work that remains. It highlights
effective policies and makes recommendations for monitoring and evaluating education targets
after 2015. It also provides policy-makers with an authoritative source with which to advocate
that education be a cornerstone of the post-2015 global development architecture.
Regional
overview:
Latin America
and the
Caribbean
In a relatively favourable context, Latin
America and the Caribbean1 made some
progress towards EFA, but unevenly. More
than half of countries with data are likely
to reach high levels of participation in preprimary education by 2015, while nearly
three countries out of five with data would
have achieved or been close to universal
primary enrolment. Most countries with
data have achieved gender parity in
primary education.
There are many signs of notable advances. The pace towards universal primary education
has quickened, gender disparity has been reduced in many countries and governments are
increasing their focus on making sure children receive an education of good quality. However,
despite these efforts, the world failed to meet its overall commitment to Education for All.
Millions of children and adolescents are still out of school, and it is the poorest and most
disadvantaged who bear the brunt of this failure to reach the EFA targets.
2
5
Education for All
The twelfth edition of the EFA Global Monitoring Report – marking the 2015 deadline for the six
goals set at the World Education Forum in Dakar, Senegal, in 2000 – provides a considered and
comprehensive accounting of global progress. As the international community prepares for a
new development and education agenda, this report takes stock of past achievements and
reflects on future challenges.
EFA Global
Monitoring Report
EFA Global
Monitoring Report
achievements and challenges
2015
Education for all 2000-2015:
Education for all
2000-2015:
achievements and challenges
UNESCO
Publishing
United Nations
Educational, Scientific and
Cultural Organization
www.unesco.org/publishing
www.efareport.unesco.org
United Nations
Educational, Scientific and
Cultural Organization
9 789231 000850
United Nations
Educational, Scientific and
Cultural Organization
1_Cover_v13.indd 1-3
I
n reviewing progress since 2000, this regional
overview summarizes findings in response to
key questions addressed by the 2015 EFA Global
Monitoring Report (GMR): What are the main
EFA achievements and failures? Which countries
advanced fastest? Which faced difficulties? Which
policy initiatives promoted access of both girls
and boys to education and improved its quality,
especially for the most disadvantaged groups and
areas? Have governments and the international
community provided adequate support? The 2015
GMR shows that despite progress, education for all
remains unfinished business in Latin America and
the Caribbean. This must be taken into account in
the post-2015 education agenda.
EFA progress and challenges
Goal 1: Early childhood care and education
Expanding and improving comprehensive early childhood
care and education, especially for the most vulnerable and
disadvantaged children.
Child mortality
■■ Latin America and the Caribbean has made significant
progress and is expected to reach the fourth Millennium
Development Goal (MDG) of reducing child mortality
rate by two-thirds between 1990 and 2015. The number
of children not reaching age 5 fell from 55 per 1,000 live
births to 32 between 1990 and 2000, and to 18 in 2013.
■■ The under-5 mortality rate improved between 2000 and
2015 in all countries with data in the region. Progress
was noticeable in countries such as Ecuador, El Salvador,
Guatemala, Nicaragua and Peru, all of which are likely to
3/11/15 8:32 PM
REGIONAL OVERVIEW
L AT I N A M E R I C A A N D T H E C A R I B B E A N
reach the fourth MDG by 2015. However, there are still
huge differences across countries, with child mortality
rates per 1,000 live births ranging from 5 in Cuba to
63 in Haiti.
■■ Having a skilled birth attendant present during
childbirth is critically important for the survival and
health of both mother and child. An alarming degree
of disparity in access exists between the poorest and
richest women in many countries. Yet great progress
has been achieved since 2000 in countries including
Colombia and Peru in increasing the number of births
aided by a skilled attendant, particularly among
the poorest. While access to skilled attendants has
been almost universal for the richest women in both
countries, the skilled birth attendance rate among
the poorest women increased dramatically from 19%
to 68% in Peru and from 66% to 86% in Colombia,
reducing the gap between income groups.
Child nutrition
■■ An average of 11% of children under 5 were suffering
from moderate or severe stunting in 2013, one of the
lowest rates across regions. However, substantial
regional variations persist, with the stunting rate
ranging from less than 5% in Jamaica to 48% in
Guatemala, where indigenous communities continue
to be the most affected by malnutrition.
Pre-primary education
E D U C AT I O N F O R A L L G L O B A L M O N I T O R I N G R E P O R T 2 0 1 5
primary education, which has resulted in the steady
improvement in enrolling children of pre-primary
age. In 2001, Mexico did this for children aged 4 to 5;
by 2012, its GER had risen to 101% from 70% in 1999.
Argentina mandated pre-primary education as early
as 1993, and its GER climbed from 57% in 1999 to
74% in 2011.
■■ A review of studies from Argentina, Brazil, Colombia
and Peru found that early interventions tended to
have a positive effect on the likelihood of enrolment
in primary school, on avoiding repetition and dropout,
and on achievement in the early primary school years.
These effects can be very large, and tend to be much
greater in the case of poor and marginalized children.
Yet, in some of the poorest countries, the chance of
attending an early learning programme is much lower
among children in rural areas and among those from
the poorest households. In Suriname, about 20% of
rural children aged 36–59 months were attending
some forms of organized ECCE programmes in 2010
compared with 63% of urban children. In Honduras,
about 50% of the poorest 5-year-olds were in early
learning programmes compared with 86% of their
richest peers in 2012.
Private sector involvement
■■ Cost is a major reason for low access to ECCE
programmes. Despite government commitment
under EFA to expand ECCE ‘especially for the most
vulnerable and disadvantaged’, provision and funding
are often left up to the non-state sector. This is
particularly the case in the Caribbean where the share
of private sector in total pre-primary enrolment was
above 80% in 2012 in half of the countries with data.
2
1999
2012
80
60
40
20
0
Regional Average
Antigua/ Barbuda
Argentina
Aruba
Barbados
Belize
Bermuda
Bolivia, P. S.
Br. Virgin Is
Chile
Colombia
Costa Rica
Cuba
Dominica
Dominican Rep.
Ecuador
El Salvador
Grenada
Guatemala
Guyana
Honduras
Jamaica
Mexico
Nicaragua
Panama
Paraguay
Peru
Saint Lucia
Suriname
Uruguay
Venezuela, B. R.
■■ The level of participation in preprimary education is high in many
countries, with only two, the
Dominican Republic and Paraguay,
with GERs below 40%. Projections
for pre-primary school enrolment
indicate that by 2015, the majority
of countries in the region with data
would have a GER above 80%. These
are mainly due to compulsory pre-
Pre-primary gross enrolment ratios (%)
■■ Since 2000, early childhood education services have
expanded considerably. The number of children
enrolled in pre-primary schools increased in the
region by 34%, from 16 million in 1999 to 21 million
in 2012. Overall participation in
pre-primary education in 2012, as
Figure 1: Changes in pre-primary education gross enrolment ratios, 1999 to 2012
measured by the gross enrolment
ratio (GER), was on average 74%, up
160
from 54% in 1999. GERs increased
140
in more than four-fifths of the thirty
countries with data, but decreased in
120
Bermuda, Guyana, Jamaica and Saint
100
Lucia, all countries in the Caribbean.
E D U C AT I O N F O R A L L G L O B A L M O N I T O R I N G R E P O R T 2 0 1 5 L AT I N A M E R I C A A N D T H E C A R I B B E A N
Private sector involvement in pre-primary education
has declined in some countries such as Colombia,
Ecuador, El Salvador and Guatemala and has risen
in others, such as the Dominican Republic, Guyana
and Peru. Despite Peru’s free and compulsory preprimary schooling, the private sector has developed
in parallel, particularly in urban areas, and mainly
serves wealthier families. Private growth in Peru
has been substantial: in 1998 the ratio of public to
private provision was 4:1; ten years later, it was nearly
equal at 1.5:1.
the average primary adjusted net enrolment ratio
(ANER) has been maintained between 93% and 94%
over the period.
■■ Country differences are observed, with the primary
ANER ranging from 75% in Guyana to 97% or above in
ten countries, including Mexico, Saint Vincent and the
Grenadines, and Uruguay. ANERs increased in several
countries, particularly in El Salvador, Guatemala and
Nicaragua, but declined in the majority of countries
with data such as the British Virgin Islands. Saint
Kitts and Nevis moved away from the target they had
achieved by 1999. The Plurinational State of Bolivia,
Colombia and Saint Lucia have also lost significant
ground since 1999.
■■ Access to fee-free pre-primary education is crucial.
Investment in this level of education provides the
greatest returns compared to other educational
levels and the most benefits for the poor. In Brazil,
government pre-schools, which do not charge fees,
attract 86% of all enrolled children.
■■ Trend projections for 29 countries with data indicate
that by 2015, 17 would achieve or be close to universal
primary enrolment (an ANER of 97% or above), while
2 countries, Guyana and Paraguay, would be far from
the target with an ANER less than 80%.
Good quality ECCE
■■ Teachers are the main determinants of quality and
their professional qualifications influence the quality
of classroom interaction more than physical settings
and resources do. Among nineteen countries in the
region with data for 2012, the percentage of trained
teachers ranged from 19% in 2012 in Dominica to
100% in Aruba, Bermuda, Colombia and Cuba. Most
of these countries have improved the percentage of
teachers with training, with Anguilla experiencing the
greatest increase in the share of trained teachers,
from 38% in 1999 to 74% in 2011, while Dominica
experienced the greatest decline going from 75% to
19% over the same period.
Goal 2: Universal primary education
Ensuring that by 2015 all children, particularly girls,
children in difficult circumstances and those belonging
to ethnic minorities, have access to, and complete, free
and compulsory primary education of good quality.
■■ The number of primary school-age children out
of school in the region was 3.7 million in 2012, a
small drop from 4 million in 1999. However, while in
Latin America the number of out-of-school children
declined by 8.9%, in the Caribbean it increased by
11.4%. In 2012, conflict-affected Colombia alone
accounted for nearly 16% of the entire region’s out-ofschool children. Among countries where at least 20%
of children did not go to school in 2000, Haiti made a
significant recovery from a severe earthquake, food
crisis and floods, and more than halved the number
of children who had never been to school between
2000 and 2012.
Figure 2: Changes in primary education adjusted net enrolment ratios, 1999 to 2012
100
Primary adjusted net enrolment ratios (%)
■■ In addition to teachers, curriculum, pedagogy and
culture all influence the quality of preschooling.
Jamaica offers an example of how countries have
improved curriculum and pedagogy for ECCE.
The country takes a developmental approach and
separates curriculum by age (0 to 3 and 4 to 5
years). In Mexico, an initiative that takes culture
into account was shown to have positive effects on
the quality of ECCE provision.
REGIONAL OVERVIEW
80
60
1999
40
2012
20
School participation
■■ Since 1999, the number of children enrolled
in primary schools in the region decreased by
7.5% to about 65 million in 2012. Despite this,
Regional Average
Aruba
Bahamas
Barbados
Belize
Bolivia, P. S.
Br. Virgin Is
Colombia
Cuba
Dominica
Dominican Rep.
Ecuador
El Salvador
Guatemala
Honduras
Mexico
Nicaragua
Panama
Paraguay
Peru
St Kitts/Nevis
Saint Lucia
St Vincent/ Grenad
Suriname
Trinidad/ Tobago
Venezuela, B. R.
0
3
Inequalities within countries
■■ Progress towards UPE is not always uniform.
Poverty, ethnicity and location affect primary
school participation and attainment. Yet, some
countries have made significant progress in access
to schooling for the poor. In Nicaragua, the primary
attainment rate among children in the poorest
households increased from 16% in 2001 to 66%
in 2009. The attainment rate of children from
the poorest households also increased sizeably
in countries such as the Plurinational State of
Bolivia, Brazil, Guatemala, Peru and Suriname. In
Guatemala, the gaps between Q’eqchi’ children
and non-indigenous children narrowed substantially
between 2000 and 2011.
140
120
100
80
60
40
1999
20
2012
Peru
St Kitts/ Nevis
Saint Lucia
St Vincent/ Grenad.
Suriname
Uruguay
Venezuela, B. R.
0
Regional Average
Antigua/ Barbuda
Argentina
Aruba
Bahamas
Barbados
Belize
Bermuda
Bolivia, P. S.
Br. Virgin Is
Chile
Colombia
Costa Rica
Cuba
Dominica
Dominican Rep.
Ecuador
El Salvador
Guatemala
Guyana
Jamaica
Mexico
Nicaragua
Panama
Paraguay
■■ Projections based on cohort analysis, which
combines intake and survival rates, show the
extent to which the goal of universal primary
education remains distant in Latin America and
the Caribbean. Of the 13 out of 106 countries
with data globally projected to achieve universal
primary education (with at least 97% of a cohort of
children likely to both enter school and reach the
last grade), not one is from the region.
Lower secondary
Upper secondary
100
90
80
70
60
50
40
30
20
1999
10
2012
0
Regional Average
Antigua/ Barbuda
Argentina
Aruba
Bahamas
Barbados
Belize
Bermuda
Bolivia, P.S.
Br. Virgin Is
Chile
Colombia
Costa Rica
Cuba
Dominica
Dominican Rep.
Ecuador
El Salvador
Guatemala
Guyana
Jamaica
Mexico
Nicaragua
Panama
Paraguay
Peru
St Kitts/ Nevis
Saint Lucia
St Vincent/ Grenad.
Suriname
Uruguay
Venezuela, B. R.
■■ The rate of survival to the last grade of primary
education in the region was 77% in 2011, the same
rate as in 1999. In other words, more than one-fifth
of pupils were dropping out too early to complete
school. In seven countries, including Brazil,
Honduras and Saint Kitts and Nevis, the survival
rate to the last grade was below 80%, while almost
all primary pupils reached the last grade in Chile,
Cuba and Mexico. Yet, early dropout is likely to
remain a concern in most countries in the region.
Figure 3: Lower and upper secondary gross enrolment ratios, 1999 to 2012
Lower secondary gross enrolment ratios (%)
Primary school completion
Transition to and participation in
secondary education
■■ As a result of higher transition and retention rates,
participation in lower and upper secondary education
has increased since 1999. On average, the lower
secondary GER increased from 95% to 98% in 2012, and
the upper secondary GER from 63% to about 76%. The
increases were particularly marked in some countries.
The lower secondary education GER increased by more
than 30 percentage points in Antigua and Barbuda,
Costa Rica, Ecuador and Guatemala. Progress in the
upper secondary GER was also seen in countries such
as the Bolivarian Republic of Venezuela where it rose
from 41% to nearly 76% between 1999 and 2012.
■■ An increasing number of adolescents who reached
the end of the primary school cycle have made the
transition into lower secondary school. Most of the
28 countries with data in the region increased their
transition rates between 1999 and 2011, with rates
rising by 25 percentage points or more in Ecuador,
Guyana, Panama and Saint Lucia.
■■ Participation levels vary significantly within the
region, with the average lower secondary education
GER of Caribbean countries (73%) considerably
lower than that of Latin America (99%) with a similar
difference at upper secondary level with GERs of 47%
in the Caribbean sub-region and of 77% for Latin
America in 2012.
Goal 3: Youth and adult skills
Ensuring that the learning needs of all young people and
adults are met through equitable access to appropriate
learning and life-skills programmes.
4
E D U C AT I O N F O R A L L G L O B A L M O N I T O R I N G R E P O R T 2 0 1 5
L AT I N A M E R I C A A N D T H E C A R I B B E A N
Upper secondary gross enrolment ratios
REGIONAL OVERVIEW
E D U C AT I O N F O R A L L G L O B A L M O N I T O R I N G R E P O R T 2 0 1 5 Inequality in lower secondary education
■■ Inequality in access to secondary education persists;
marginalized groups are the most affected. Analysis
of household survey data reveals differences in the
likelihood of transitioning from primary to lower
secondary school and from lower secondary to
upper secondary school between children from the
richest and poorest households in low and medium
income countries. In the Plurinational State of
Bolivia, Colombia and Haiti, the gaps between wealth
groups did not change noticeably since 2000. In the
Plurinational State of Bolivia, 86% of adolescents
from the poorest households who reached the end of
primary school continued into lower secondary school
in 2008 compared to nearly 99% of adolescents from
the richest households, only a slight improvement
from 2003. Inequalities in the attainment of lower
secondary education also relate to where adolescents
live, though this rural–urban gap has substantially
reduced over time in countries such as in Colombia,
Mexico and Peru. In Peru, the gap in the attainment
rate in 2000 was about 40 percentage points; only
43% of adolescents graduated from lower secondary
school in rural areas. By 2012, the gap had fallen to 25
percentage points with 61% of adolescents graduating.
■■ Access to secondary school has been an issue for
marginalized groups, including working children and
migrants. Working students lag behind in acquiring
foundation skills. Many young people worked
exclusively and many others combined work with
schooling, though patterns differ across countries.
Substantial proportions of adolescents of secondary
school age continued to work outside of school, but
the situation improved in countries like Colombia,
Ecuador, El Salvador and Guatemala. Guatemala
had the highest proportion of working 15-17 year old
adolescents, with 40.5% of those either working and
going to school or exclusively working in 2011, though
the share was down from 54% in 2000.
Technical and vocational skills
■■ Despite greater attention to TVET in recent years,
and clearer understanding and definitions of the
skills involved, this type of programme remains of
low priority in the Latin America and the Caribbean
region. In 2012, technical and vocational programmes
accounted for an average of only 10% of total
secondary enrolment in the region, while the share
of TVET differed between the two sub-regions: 10% in
Latin America and 2.5% in the Caribbean. In 11 of 17
countries with data for both 1999 and 2012, the share
of TVET in total secondary enrolment has decreased,
L AT I N A M E R I C A A N D T H E C A R I B B E A N
REGIONAL OVERVIEW
for example by 14 percentage points in Dominica and
30 points in Panama.
Goal 4: Adult literacy
Achieving a 50 per cent improvement in levels of adult
literacy by 2015, especially for women, and equitable access
to basic and continuing education for all adults.
Adult literacy rates and illiterates
■■ The estimated adult literacy rate was 92% in 2012
in the region as a whole, ranging from 69% in the
Caribbean sub-region to 93% in Latin America. This
is equivalent to 33 million people lacking basic skills,
of whom 55% were adult women, a percentage that
has not changed since 2000 when the total number
of adult illiterates was 38 million. The regional adult
illiteracy rate fell by 28% between 1990 and 2000, and
between 2000 and 2015 is projected to further fall by
36%. But this is not enough to reach the goal 4 target
to halve the 2000 adult illiteracy levels by 2015.
■■ Projections to 2015 indicate that, among the
countries of the region with a literacy rate below
95% in 1995–2004, only Peru, Suriname and the
Plurinational State of Bolivia would have reduced
their 2000 adult illiteracy rate by more than half
by 2015, with respective declines of 55%, 57% and
67%. Five countries would be close to the target with
decreases in adult illiteracy rates ranging from 40% to
49%, 5 would fall into an intermediate position with a
reduction of 30% to 39%, while 2 countries, Colombia
and Nicaragua, would be still far from the target with
a decline of only 26%.
■■ The Dakar Framework made explicit reference for
Goal 4 to be reached ‘especially for women’. Gender
parity has been achieved in most countries in the
region, with the average GPI in adult literacy at 0.99.
However, important gender disparities in adult literacy
remain in countries such as Guatemala and Haiti,
in favour of men, and to a lesser extent in Jamaica,
favouring women.
Direct assessment of literacy
■■ Countries and international agencies are conducting
more sophisticated investigations to gauge not only
whether adults are ‘literate’ or ‘illiterate’ but also
their level of literacy and the consequences for
individuals and societies. Among these more accurate
literacy surveys are the Skills towards Employment
and Productivity (STEP) surveys, including literacy,
launched by the World Bank in 13 middle income
countries in 2010 and UNESCO’s Literacy Assessment
5
L AT I N A M E R I C A A N D T H E C A R I B B E A N
■■ In the Plurinational State of Bolivia and
Colombia, the STEP surveys showed clear
relationships between reading proficiency
and the amount of reading required by the
respondents’ occupation. LAMP results
for Paraguay show that adults in rural
areas have lower prose reading skills
than urban dwellers. Only 9% of rural
adults achieved the highest level in prose
reading skills compared with 20% of urban
adults, possibly because fewer rural than
urban residents identify Spanish as a
mother tongue. There was no such gap
between rural and urban areas in terms of
numeracy skills.
E D U C AT I O N F O R A L L G L O B A L M O N I T O R I N G R E P O R T 2 0 1 5
Figure 4: Gender parity indices in the primary and secondary gross enrolment ratios,
1999 and 2012
Gender disparities in primary education
1.20
1.10
1.00
0.90
0.80
0.70
0.60
0.50
0.40
1999
0.30
2012
0.20
0.10
0.00
Regional Average
Argentina
Aruba
Bahamas
Barbados
Belize
Bermuda
Bolivia, P. S.
Br. Virgin Is
Chile
Colombia
Costa Rica
Cuba
Dominica
Dominican Rep.
Ecuador
El Salvador
Grenada
Guatemala
Guyana
Honduras
Mexico
Nicaragua
Panama
Paraguay
Peru
St Kitts/ Nevis
Saint Lucia
St Vincent/ Grenad.
Suriname
Trinidad/ Tobago
Uruguay
Venezuela, B. R.
and Monitoring Programme (LAMP) that
defines three levels of literacy attainment.
GPI of GERs
REGIONAL OVERVIEW
Goal 5: Gender parity and equality
Gender disparities in primary education
1.50
1.40
1.30
1.20
1.10
1.00
0.90
0.80
0.70
0.60
0.50
0.40
0.30
0.20
0.10
0.00
■■ In primary education, the regional gender
parity index (GPI) increased slightly from
0.96 in 1999 to 0.97 in 2012 (0.99 in the
Caribbean and 0.97 in Latin America), with
most of the countries with data close to or
achieving gender parity at this education
level. Projections of countries with data
indicate that by 2015, 20 of the 33 countries
with data in the region would have achieved
gender parity in primary education (a GPI of 0.97–1.03),
7 would be closed to the target (a GPI of 0.95–0.96 or
1.04–1.05), and 6 would be at an intermediate position
(a GPI of 0.80–0.94 or 1.06–1.25).
■■ Since 1999, significant progress has been achieved
to reduce gender disparity in countries where girls
faced the worst disadvantage. In Guatemala, the GPI of
primary GER went from 0.87 in 1999 to nearly 0.97 in
2012. Several countries that had reached the gender
parity target in 1999 have being moving away from it,
either slightly (Chile, Colombia, El Salvador, Paraguay
and Uruguay) or more significantly (Guyana). In Guyana,
the situation of boys has deteriorated; they are now
underrepresented in primary school enrolment.
■■ When enrolled, girls stand an equal or better chance
than boys of continuing to the upper grades of primary
6
1999
2012
Regional Average
Antigua/ Barbuda
Argentina
Aruba
Bahamas
Barbados
Belize
Bermuda
Bolivia, P. S.
Br. Virgin Is
Chile
Colombia
Costa Rica
Cuba
Dominica
Dominican Rep.
Ecuador
El Salvador
Guatemala
Guyana
Jamaica
Mexico
Nicaragua
Panama
Paraguay
Peru
St Kitts/ Nevis
Saint Lucia
St Vincent/ Grenad.
Suriname
Uruguay
Venezuela, B. R.
Eliminating gender disparities in primary and
secondary education by 2005, and achieving
gender quality in education by 2015, with a focus
on ensuring girls’ full and equal access to and
achievement in basic education of good quality.
GPI of GERs
Gender disparities in secondary education
school. Even in countries where girls suffer from some
disadvantage at the point of initial intake, survival rates
to grade 5 among enrolled children generally show
gender gaps at the expense of boys. This is the case
in Colombia, the Dominican Republic, El Salvador,
Honduras, Paraguay and the Bolivarian Republic
of Venezuela.
Inequalities within countries
■■ Poverty deepens gender disparities in completing
primary education, but this is often at the expense of
boys in Latin America and the Caribbean. Countries
including Brazil, the Dominican Republic and
Nicaragua have seen gender disparity in primary
attainment at the expense of the poorest boys improved
since 2000, while in countries including Haiti, wide
E D U C AT I O N F O R A L L G L O B A L M O N I T O R I N G R E P O R T 2 0 1 5 disparities have emerged, with the poorest boys now
less likely to complete primary education.
Gender disparities in secondary education
■■ Gender disparities are wider and more varied
in secondary education. Latin America and the
Caribbean was the only region with disparities at the
expense of boys. In 2012, the region’s GPI of secondary
GER was at 1.07, unchanged from 1999, reflecting
fewer boys than girls enrolled. In most of these
countries, gender gaps at the expense of boys have
remained or even widened between 1999 and 2012. In
Argentina, the GPI went from 1.05 in 1999 to 1.11 in
2011, in Bermuda from 1.07 to 1.18 and in Suriname
from 1.19 to 1.31.
■■ According to projections, of 33 countries with data,
only 11 will reach the gender parity target by 2015, 3
would be close, while the majority, 18, would be far
from the target. Suriname, where less than 80 boys to
100 girls were in secondary education in 2011, would
be the only country in the region projected to be very
far from the gender parity target in 2015.
■■ Poor primary attainment and dropout from secondary
reinforce disparity. In Brazil, disparity in lower
secondary attainment has widened at the expense
of boys, primarily as a result of increasing dropout
among boys. Their GPI for lower secondary attainment
rose from 1.12 in 2000 to 1.18 in 2010. Boys were even
more likely than girls to drop out in upper secondary
in Brazil. In Brazil as well as in Jamaica, boys in
low income urban settings often drop out to work
in semi-skilled jobs that do not require completion
of secondary education because they see education
as offering no guarantee of future employment.
Economic hardship also enhances susceptibility to
gang membership and violence, often underpinned
by a lack of educated male role models and
perceptions of schooling as unmanly, for example in
the Caribbean.
Gender equality
■■ Achieving gender equality in education requires not
only that girls and boys have an equal chance to
participate in education, but also that students benefit
from a gender-sensitive learning environment.
■■ The proportion of female teachers is typically an
indicator of progress towards gender equality. In 2012,
the share of female teachers in primary education in
the region was 78%, but this figure falls to 58% at the
secondary level. Regional averages mask disparities
L AT I N A M E R I C A A N D T H E C A R I B B E A N
REGIONAL OVERVIEW
across countries. In secondary education, the female
share of teaching staff was well above 70% in several
Caribbean countries like Bahamas, Dominica and
Suriname, but less than 50% in Guatemala and Peru.
■■ School-related gender-based violence seriously
undermines attempts to achieve gender equality
in education. In Latin America and the Caribbean,
studies have largely focused on physical violence,
including the spillover effects of gang violence in
schools. Yet broad social tolerance for family and
community violence, especially against women,
provides the social context for sexual violence
against girls by male students and teachers. A study
concerning female adolescent victims of sexual
violence in Ecuador found that 37% of perpetrators
were teachers.
■■ Learning assessments highlight gender differences in
subject performance. In assessing the performance
of 15-year-old students in 2012, PISA results showed
a widening gap in reading, with girls performing
significantly better than boys in Brazil, Mexico
and Peru. Gender differences are also reported in
mathematics, with boys performing better than girls
in Chile, Colombia, Mexico and Peru, although the gap
narrowed in Brazil and Uruguay. In Argentina, girls
outperformed boys in mathematics.
■■ Subject choice can limit labour market opportunities.
In the few countries with data available in the region,
the share of female students in science ranged
from 21% in Chile to about 50% or above in Guyana
and Panama in 2012. In the field of engineering/
manufacturing and construction, the percentage
ranged from nil in Barbados in 2010 to about 43%
in Antigua and Barbuda in 2012. Female underrepresentation in scientific fields exacerbates gender
gaps in income, as workers in these fields earn
significantly more than counterparts in other fields.
Goal 6: Quality of education
Improving all aspects of the quality of education and
ensuring excellence of all so that recognized and
measurable learning outcomes are achieved by all,
especially in literacy, numeracy and essential life skills.
Monitoring progress in learning outcomes
■■ More and more countries have been carrying out
national assessments. In Latin America and the
Caribbean, the percentage of countries that carried
out at least one national assessment between 2000
and 2013 was 63% compared with 56% between 1990
7
REGIONAL OVERVIEW
L AT I N A M E R I C A A N D T H E C A R I B B E A N
and 1999. National assessments are predominantly
curriculum-based and subject-oriented, in contrast
to international assessments, which focus on crosscurricular knowledge, skills or competencies.
■■ In addition to the growing use of national assessments,
countries have increasingly joined cross-national
comparisons of student achievement (such as SERCE/
TERCE, PISA, TIMSS and PIRLS). Results showed
that many countries – most notably Ecuador – made
significant improvement in national mean scores.
Learning outcomes
■■ Although there are no evident teacher shortages in
Latin America and the Caribbean, teacher training
remains an issue in many countries. The median
percentage of trained primary teachers was 85% in
the region in 2012, but was less than 60% in Barbados
and Belize; all primary school teachers had received
training in Aruba, Bermuda, Colombia and Cuba. Of
nineteen countries with data for both 1999 and 2012,
the majority showed increases in the percentage
of trained teachers, including in Bahamas and
Saint Vincent and the Grenadines. In Bahamas, the
percentage of trained teachers increased from 58% to
nearly 92% between 1999 and 2010.
■■ Comparing SERCE (2006) and TERCE (2013) results
reveals that the rural–urban gap has been reduced
overall. In 2006, most countries showed very large
gaps in reading proficiency between urban and rural
students. Although some gaps persisted in 2013 in
Colombia, Nicaragua and the Dominican Republic, it
is encouraging that in the rest of the countries, the
urban–rural gap substantially narrowed, including
in Argentina, Brazil, Costa Rica and Uruguay. This
reduction of inequality occurred over the same period
that mean achievement increased, showing that it
is possible to improve quality while simultaneously
increasing equity. PISA results show the same trends,
with the most disadvantaged students witnessing the
largest increases in mathematics scores between 2003
and 2012, as shown in Mexico, where policies were
aimed at improving the performance of low achieving
schools and students by allocating more resources to
the regions and schools most in need.
■■ Salaries have a direct impact on the attractiveness
and prestige of teaching. Yet, teachers often receive
inadequate pay. In Peru, other professionals of similar
background and qualifications earned 50% more than
pre-school and primary school teachers.
■■ However, in some countries, many schools do not teach
students the basics of arithmetic in their early years.
In Nicaragua in 2011, around 60% of second-graders
could not identify numbers correctly and more than
90% were unable to answer a subtraction question.
Even in grade 4, almost 20% and 70%, respectively,
failed at these tasks.
■■ Teacher absenteeism takes a toll on student learning
by reducing the number of hours that children are
actually taught. One-third of pupils in Argentina and
Paraguay reported problems with teachers’ late arrival,
absenteeism and skipping class.
Investing in teachers
■■ The total number of primary school teachers in the
region has increased by about 14% since 1999 to more
than 3 million in 2012. The average number of pupils
to primary school teacher (PTR) was 23:1 in 2012,
down from 26:1 in 1999. PTRs ranged from less than
10:1 to around 30:1 in El Salvador and Nicaragua.
PTRs declined in almost all twenty-nine countries with
data, particularly in Chile and Guatemala where PTRs
decreased by almost 11 and 12 pupils per teacher,
respectively.
8
E D U C AT I O N F O R A L L G L O B A L M O N I T O R I N G R E P O R T 2 0 1 5
Instructional time
■■ Instructional time has been shown to enhance
learners’ exposure to knowledge and result in
significant learning gains. In the late 2000s, countries
in the region mandated 792 hours of instructional time
per year in the early primary grades, increasing in
subsequent grades to reach about 906 hours in grade
8. In Chile, where the government gradually lengthened
the school day, high school students under a full
school day regime had higher achievement levels in
language and mathematics than their peers under a
shorter regime.
Government policies and actions to
accelerate progress towards EFA goals
since 2000
Varying policy approaches have been designed and
implemented over the past 15 years to expand quality
ECCE programmes, increase equitable access to
education, improve school completion and education
quality, and promote gender equality. Box 1 indicates
some of the policies and strategies that governments in
Latin America and the Caribbean have developed to tackle
the twin challenges of equity and quality.
E D U C AT I O N F O R A L L G L O B A L M O N I T O R I N G R E P O R T 2 0 1 5 L AT I N A M E R I C A A N D T H E C A R I B B E A N
REGIONAL OVERVIEW
Box 1: Examples of policies implemented over the past 15 years to:
INCREASE ACCESS
ff Reducing costs: Cash transfer programmes
to vulnerable households were pioneered
in Latin America and have been extensively
analysed for their impact. Flagship
programmes in Brazil (Bolsa Familia),
Colombia (Familias en Acción) and Mexico
(Oportunidades) now cover over 50%
of poor households. Most cash transfer
programmes had a positive impact on
enrolment, attendance and dropout.
Many targeted children with specific
vulnerabilities, such as extreme poverty,
remoteness, caste, gender, and being from
an indigenous population. Nicaragua’s
short-lived Red de Protección Social (2000–
2006) was evaluated as well targeted,
with the largest impacts on enrolment
and attendance of those from extremely
poor households. In Mexico, the impact of
Oportunidades was calculated to be largest
for the children with the lowest propensity
to enrol in pre-school programmes.
EXTEND EDUCATIONAL OPPORTUNITIES
ff Poorest children: ECCE programmes
generally do not reach the poorest and
most disadvantaged children, who stand
to gain the most from them in terms of
improved health, nutrition and cognitive
development. Some governments took
strides to provide access to good quality
ECCE to the poorest and most marginalized,
such as in Colombia with its 2006 National
Public Policy for Early Childhood, its
National Development Plan for 2010–2014,
and its ‘From Zero to Forever’ policy that
created a comprehensive system of early
childhood development, targeting the
poor and vulnerable in particular. Many
countries have also developed multisector
approaches to improve early childhood
services. In Colombia, 25% of low income
children under 5 receive comprehensive
ECCE services and 42% are enrolled in
day care.
ff Indigenous groups: Since the 1990s,
international aid supporting intercultural
and bilingual education programmes
has grown in the region. In Guatemala,
reforms included the National Languages
Law in 2003, which demanded respect
for indigenous languages, and the
establishment of a Vice-Ministry of Bilingual
Intercultural Education, also in 2003, which
set up bilingual teacher training colleges
and primary-level bilingual education. These
measures had a major impact in a context
where levels of initial education attainment
were low and many indigenous people did
not speak the dominant language.
ff Migrant children and youth: Since 2012,
migrant children and youth in Ecuador have
no longer been defined as foreigners, but
rather as ‘vulnerable’, with special needs
related to ‘human mobility’. Under the
new constitution, Ecuador is committed to
guarantee that private, public and religious
schools will provide support and adapt the
learning environment to satisfy the needs of
this population.
PROMOTE GENDER EQUALITY
ff Addressing gender disparity at the
expenses of boys: Since 2000, countries
such as Belize, El Salvador and Trinidad and
Tobago, have introduced several standalone policies and interventions. These
include strategies to mainstream technical
and vocational subjects into the curriculum,
school and community-based programmes
to tackle youth crime and violence,
and mentoring initiatives. In Jamaica,
a government programme providing
education grants to vulnerable households
introduced higher payments for boys
enrolled in secondary school as a response
to boys’ lower attainment, thus benefiting
boys from poorer households who are at
greater risk of leaving school.
ff Tackling early marriage and adolescent
pregnancy: The incidence of child marriage
has been reduced substantially in Bolivia;
however, in Latin American countries the
high rate of pregnancy among adolescents
is a serious public policy issue. In Chile,
being a mother reduces the likelihood of
secondary education completion by 24% to
37%. Programmes working directly with girls
are particularly successful. The Abriendo
Oportunidades project for indigenous girls
in Guatemala had reached 3,500 girls by
2011 with the results that all participants had
completed sixth grade, compared with less
than 82% of their peers nationally, and 97%
remained childless during the programme,
compared with 78% of non-participants.
ff Enhancing gender-sensitivity among
teachers: In Trinidad and Tobago, the
Commonwealth of Learning, in partnership
with UNICEF, supports gender-sensitive,
child-friendly schooling approaches in preservice and in-service teacher education.
Some governments have also made
efforts to include gender training in formal
teacher education policy and programmes.
Mexico’s 2013–2018 national education plan
promotes a gender-sensitive approach to
teacher education; in-service programmes
can support gender-sensitive classroom
practices, but are optional.
ff Including gender in curricula: Gender
reviews of curricula have helped raise
awareness and supported change
towards more gender-responsive content
and resources. An interdisciplinary
curriculum developed for the Sistema de
Aprendizaje Tutorial, a secondary school
programme for rural and indigenous girls
in Honduras, poses questions to dominant
power structures and challenges gender
stereotypes.
ff Addressing violence in schools: School
environment in the region is affected by
physical violence, including the spillover
effects of gang violence in schools.
Programmes promoting non-violence
among men and boys, such as ReproSalud
in Peru, demonstrate positive shifts in
attitudes. In Brazil, Instituto Promundo
and its partners have implemented
promising programmes that use trained
teacher and student facilitators to work
with boys and young men from secondary
schools to promote non-violence and reflect
on gender norms.
IMPROVE QUALITY
ff Teachers: To achieve quality in ECCE,
teachers must receive the high quality
training necessary to fulfil required
qualifications, and the requirements must
be adhered to. Countries are increasingly
defining clear requirements for education
and training for pre-primary teachers that
are considerably more stringent since 2000.
In Colombia, regulations require teachers
to have tertiary education as well as direct
ECCE experience, while workers in family
and home-based programmes are required
to have a university degree as well as ECCE
experience.
ff School feeding programmes: School
feeding programmes help ensure that
children who attend school remain
healthy. In El Salvador, school feeding is
9
REGIONAL OVERVIEW
L AT I N A M E R I C A A N D T H E C A R I B B E A N
fully incorporated into national planning
and was a flagship programme of the last
two presidential campaigns. Public officials
argue that, given the high public demand, it
would be extremely damaging politically to
remove or reduce the size of school feeding
programmes.
ff Curriculum: Curriculum reform aims to make
content more relevant to the contemporary
needs of individuals, communities and
societies. The Plurinational State of Bolivia
introduced a new national, regional and local
curriculum to enable inclusion of activities and
knowledge seen as useful and appropriate to
the lives of particular groups of children.
ff Fostering child-friendly schools: One of
the most important requirements for better
quality in education is an improved learning
environment, encompassing the physical
school infrastructure and interaction between
children and teachers. In the past 15 years,
several countries, including Nicaragua,
have adopted the UNICEF child-friendly
school model. The model emphasizes the
school as a place that provides learning
opportunities relevant to life and livelihood,
Finance
Mobilize strong national and international political
commitment for education for all, develop national action
plans and enhance significantly investment in education.
Domestic expenditure on education
■■ In 2012, half of countries with data in Latin America
and the Caribbean spent about 5% of GNP or more on
education. The percentage ranges from less than 3% in
countries such as Antigua and the Barbuda, Bermuda
and Peru to 13% in Cuba.
■■ The share of national income devoted to education
increased between 1999 and 2012 in most of the
22 countries with data, with an increase of six
percentage points in Cuba. While economic growth
for the region averaged 3.5% per annum, growth in
public expenditure on education averaged 5.3% per
year. In 12 of the 18 countries with data in the region,
progress in public spending on education exceeded
economic growth.
■■ In 2012, the median share of government budget on
education was 14.8%, with wide regional variation:
Antigua and Barbuda allocated less than 7% of its total
government expenditure on education compared with
more than 20% in Belize and the Bolivarian Republic
of Venezuela.
■■ While education is not prioritized in many national
budgets in the region, progress is noted. In the
majority of the 18 of countries with data, the share of
government expenditure on education has improved
between 1999 and 2012. This was particularly so
in Brazil where the percentage increased by 5
percentage points to around 15%, and in Uruguay
10
E D U C AT I O N F O R A L L G L O B A L M O N I T O R I N G R E P O R T 2 0 1 5
in a healthy, safe environment that is
inclusive and protective, is sensitive to
gender equity and equality, and involves
the participation of students, families and
communities. The model has offered an
entry point for overcoming disadvantage
and enhancing equity, as in the case of
indigenous children in Belize. Evaluation of
child-friendly schools including in Guyana
and Nicaragua highlighted challenges to
effective implementation such as poor school
infrastructure and lack of maintenance.
where it increased by 6 points to 14%, though both
are still below the recommended minimum 15%
expenditure level.
■■ Education expenditure allocation is not equitable.
Primary education is obviously a priority in many
countries, accounting for nearly 34% or more of the
total education expenditure in 2012 in half of countries
with data in the region, but the median share of preprimary education was only 6%. In 2009 in Antigua and
Barbuda, the share of primary education in total public
spending on education was 49% while the percentage
devoted to pre-primary education was only 0.3%.
International development assistance
■■ Levels of aid to basic education for the Latin American
and Caribbean region increased from US$218 million
to US$330 million between 2002 and 2012. Annual
growth rates of aid disbursements to basic education
averaged 5% per annum between 2002 and 2012 while
aid disbursements to total education grew on average
by 6% per annum. On average between 2002–04 and
2010–12, 7% of total aid disbursed to basic education
was for Latin America and the Caribbean.
■■ Aid provision, which was once the preserve of OECD,
has changed since Dakar with emerging donors
formalizing development cooperation through the
creation of aid agencies. In 2013, Brazil announced
the creation of an agency on cooperation, trade and
investments. Brazil largely provides scholarships and
international exchange programmes for students from
partner countries, disbursing some US$174 million
over 2005–2010, but also supports partner countries
with poor higher education systems through its Higher
Education Coordination Agency’s CAPES programme,
which in 2010 spent around US$5.3 million.
E D U C AT I O N F O R A L L G L O B A L M O N I T O R I N G R E P O R T 2 0 1 5 L AT I N A M E R I C A A N D T H E C A R I B B E A N
REGIONAL OVERVIEW
Table 1: Education for all development index (EDI) and prospects for education for all goals 1, 2, 4 and 5
MEAN DISTANCE TO EFA OVERALL ACHIEVEMENT AS MEASURED BY THE EDUCATION FOR ALL DEVELOPMENT INDEX (EDI), 2012
Overall EFA achieved (EDI between 0.97 and 1.00)
(1): Cuba
Close to overall EFA (EDI between 0.95 and 0.96)
(7): Aruba, Bhamas, Chile, Ecuador, Mexico, Uruguay and the Bolivarian Republic of Venezuala
Intermediate position (EDI between 0.80 and 0.94)
(15): Belize, Barbados, Bermuda, Bolivia (the Plurinational State of), Colombia, Costa Rica, Dominican Republic, El Salvador, Guatemala, Guyana,
Honduras, Panama, Paraguay, Peru and Saint Lucia
Far from overall EFA (EDI below 0.80)
None
Not included in the EDI calculation
(insufficient or no data)
(20): Anguilla, Antigua and Barbuda, Argentina, Brazil, British Virgin Islands, Cayman Islands, Curaçao, Dominica, Grenada, Haiti, Jamaica, Montserrat,
Nicaragua, Saint Kitts and Nevis, Saint-Martin, Saint Vincent and the Grenadines, Sint-Maarten, Suriname, Trinidad and Tobago and Turks and Caicos
PROSPECTS FOR EDUCATION FOR ALL GOALS 1, 2, 4 AND 5
Goal 1 – Likelihood of countries achieving a pre-primary gross enrolment ratio of at least 80% by 2015
High level (GER: 80% and above)
(18): Antigua and Barbuda, Argentina, Aruba, Barbados, British Virgin Islands, Chile, Costa Rica, Cuba, Dominica, Ecuador, Grenada, Jamaica, Mexico,
Peru, Suriname, Trinidad and Tobago, Uruguay and Venezuela (Bolivarian Republic of)
Intermediate level (GER: 70–79%)
(4): El Salvador, Guatemala, Nicaragua and Panama
Low level (GER: 30–69%)
(11): Anguilla, Belize, Bermuda, Bolivia (the Plurinational State of), Cayman Islands, Colombia, Dominican Republic, Guyana, Honduras, Paraguay and
Saint Lucia
Very low level (GER: <30%)
None
Not included in the prospects analysis
(insufficient or no data)
(10): Bahamas, Brazil, Curaçao, Haiti, Montserrat, Saint Kitts and Nevis, Saint-Martin, Saint Vincent and the Grenadines, Sint-Maarten and Turks and
Caicos
Target reached (ANER: 97% and above)
(14): Aruba, Bahamas, Barbados, Belize, Cuba, El Salvador, Guatemala, Grenada, Honduras, Mexico, Nicaragua, Saint Vincent and the Grenadines,
Trinidad and Tobago and Uruguay
Close to target (ANER: 95–96%)
(3): Ecuador, Peru and Venezuela (Bolivarian Republic of)
Intermediate position (ANER: 80–94%)
(10): Anguilla, Bolivia (the Plurinational State of), British Virgin Islands, Colombia, Dominica, Dominican Republic, Panama, Saint Lucia, Saint Kitts and
Nevis and Suriname
Far from target (ANER: <80%)
(2): Guyana and Paraguay
Not included in the prospects analysis
(insufficient or no data)
(14): Antigua, Argentina, Bermuda, Brazil, Cayman Islands, Chile, Costa Rica, Curaçao, Haiti, Jamaica, Montserrat, Saint-Martin, Sint-Maarten and Turks
and Caicos
Goal 2 – Country prospects for achieving universal primary enrolment by 2015
Goal 4 – Country prospects for achieving the adult literacy target of halving the adult illiteracy rate by 20151
Adult literacy rate: 97% and above
(6): Argentina, Aruba, Chile, Cuba, Trinidad and Tobago and Uruguay
Target achieved
(adult illiteracy halved or reduced by more)
(4): Bolivia (the Plurinational State of), Costa Rica, Peru and Suriname
Close to target
(adult illiteracy rate reduced by 40-49%)
(5): Guatemala, Honduras, Jamaica, Mexico and Venezuela (Bolivarian Republic of)
Intermediate position
(adult illiteracy rate reduced by 30-39%)
(5): Brazil, Dominican Republic, Ecuador, El Salvador and Panama
Far from target
(adult illiteracy rate reduced by less than 30%)
(2): Colombia and Nicaragua
Not included in the prospects analysis
(insufficient or no comparable data)
(20): Anguilla, Antigua and Barbuda, Bahamas, Barbados, Belize, Bermuda, British Virgin Islands, Cayman Islands, Curaçao, Dominica, Grenada,
Guyana, Haiti, Montserrat, Paraguay, Saint Kitts and Nevis, Saint Lucia, Saint Vincent and the Grenadines, Saint-Martin, Sint-Maartenand Turks
and Caicos
Goal 5 – Country prospects for achieving gender parity in primary and secondary education by 2015
Gender parity in primary education
Target reached (GPI: 0.97-1.03)
(20): Anguilla, Argentina, Aruba, Bahamas, Barbados, Belize, Bermuda, Bolivia (the Plurinational State of), Costa Rica, Cuba, Dominica, Ecuador,
Guatemala, Honduras, Mexico, Nicaragua, Panama, Peru, Saint Kitts and Nevis and Venezuela (Bolivarian Republic of)
Close to target (GPI: 0.95-0.96 or 1.04-1.05)
(7): Chile, Colombia, El Salvador, Paraguay, Saint Lucia, Trinidad and Tobago and Uruguay
Intermediate position (GPI: 0.80-0.94 or 1.06-1.25)
(6): British Virgin Islands, Dominican Republic, Grenada, Guyana, Saint Vincent and the Grenadines and Suriname
Far from target (GPI <0.80 or >1.25)
None
Not included in the prospects analysis
(insufficient or no data)
(10): Antigua and Barbuda, Brazil, Cayman Islands, Curaçao, Haiti, Jamaica, Montserrat, Saint-Martin, Sint-Maarten and Turks and Caicos
Target reached (GPI: 0.97-1.03)
(11): Anguilla, Bolivia (the Plurinational State of), Chile, Cuba, Dominica,Ecuador, El Salvador, Grenada, Peru, Saint Lucia and Saint Kitts and Nevis
Close to target (GPI: 0.95-0.96 or 1.04-1.05)
(3): Aruba, Bahamas and Costa Rica
Intermediate position (GPI: 0.80-0.94 or 1.06-1.25)
(18): Antigua and Barbuda, Argentina, Barbados,Belize, Bermuda, British Virgin Islands, Colombia, Dominican Republic, Guatemala, Guyana, Jamaica,
Mexico, Nicaragua, Panama, Paraguay, Saint Vincent and the Grenadines, Uruguay, and Venezuela (Bolivarian Republic of)
Far from target (GPI <0.80 or >1.25)
(1): Suriname
Not included in the prospects analysis
(insufficient or no data)
(10): Brazil, Cayman Islands, Curaçao, Haiti, Honduras, Montserrat, Saint-Martin, Sint-Maarten, Trinidad and Tobago and Turks and Caicos
Gender parity in secondary education
1. Countries included are those where the adult literacy rate estimated in the period 1995–2004 was lower than 95%, and where both the baseline estimates and the 2015 projections are based on the method of
self-declaration or declaration on behalf of others.
11
REGIONAL OVERVIEW
E D U C AT I O N F O R A L L G L O B A L M O N I T O R I N G R E P O R T 2 0 1 5
L AT I N A M E R I C A A N D T H E C A R I B B E A N
Table 2: Latin America and the Caribbean, selected education indicators
Adult literacy
Total
population
GNP per
capita
(000)
PPP
(US$)
2015
Country or territory
Compulsory
education
2012
EFA
Development
Total
Index
(%)
(EDI)
Early childhood care and education
Adult literacy rate
Adult illiterates
(15 and over)
(15 and over)
GPI
(F/M)
1995–20041
Total
(%)
GPI
(F/M)
2005–20121
Age group
2012
5-17
…
…
…
…
5-16
…
99
1.01
99
Total
(000)
%
Female
Total
(000)
Child survival and
well-being
Pre-primary
education
Moderate
or severe
Under -5
and
mortality rate stunting
GER
%
Female
1995–20041
2005–20121
…
…
…
…
1.01
0.6
30
(‰)
2000
Primary adjusted
NER
Out-of-school
children2
Total
Total
Total
Total
Total
(%)
(%)
(%)
(%)
(%)
(000)
2015
2008–
20121
1999
2012
1999
2012
1999
The Caribbean
Anguilla
15
Antigua and Barbuda
92
...
18,920
...
…
...
...
...
...
...
99
...
0.01
0.7
29
17
10
...
57
89
...
85
...
3
Aruba
104
4-17
0.965
97
1.00
97
1.00
2
57
55
21
17
...
94
107
98
99
0.2
Bahamas
388
29,020
5-16
0.964
…
…
…
…
…
…
…
…
19
13
...
11
...
91
98
3
Barbados
287
25,670
5-16
0.940
…
…
…
…
…
…
…
…
18
11
...
75
79
95
97
1.1
Belize
348
7,630
5-14
0.928
…
…
…
…
…
…
…
…
24
14
19
28
47
100
99
0.1
Bermuda
66
...
5-16
0.923
…
…
…
…
…
…
…
…
...
...
...
56
43
British Virgin Islands
29
...
5-17
…
…
…
…
…
…
…
…
…
...
...
...
62
71
60
...
5-16
…
…
…
99
1.00
…
…
…
...
...
...
39
164
...
…
…
…
…
…
…
…
…
…
…
18
12
...
...
Cayman Islands
Curaçao
0.5
...
88
...
98
85
0.04
...
95
...
0.2
...
...
...
...
96
Dominica
73
11,980
5-16
…
…
…
…
…
…
…
…
…
...
...
...
82
95
98
Grenada
107
10,350
5-16
…
…
…
…
…
…
…
…
…
17
12
...
75
99
100
Guyana
808
3,340
6-15
0.860
…
…
85
1.06
…
…
74
43
47
33
18
100
66
...
75
10,604
1,220
Haiti
Jamaica
2,813
Montserrat
5
Saint Kitts and Nevis
Saint Lucia
Trinidad and Tobago
Turks and Caicos Islands
6-11
…
59
0.87
49
0.84
2259
56
2,994
56
99
63
22
...
...
...
...
...
...
6-14
…
80
1.16
87
1.12
341
36
250
32
33
23
5
79
75
93
...
25
...
5-16
…
…
…
…
…
…
…
…
…
...
...
...
137
...
100
...
-
5-16
…
…
…
…
…
…
…
…
…
...
...
...
...
96
97
84
0.2
185
11,300
5-15
0.909
…
…
…
…
…
…
…
…
20
13
...
81
61
93
83
1.7
…
…
…
…
…
…
…
…
…
…
...
...
...
...
...
...
...
...
5-16
…
…
…
…
…
…
…
…
…
27
21
...
...
...
98
99
0.3
…
…
…
…
…
…
…
…
…
…
...
...
...
...
...
...
...
...
5
109
...
10,870
47
Suriname
0.0
...
17,630
...
Sint-Maarten
0.2
55
Saint-Martin
Saint Vincent and the Grenadines
...
...
548
8,380
7-12
…
90
0.95
95
0.99
36
62
20
57
34
21
9
85
88
91
92
1,347
22,860
6-12
…
98
0.99
99
0.99
17
69
13
66
36
29
...
60
...
98
99
4
...
4-17
…
…
…
…
…
…
…
…
…
...
...
...
...
...
...
...
...
...
4-18
…
…
…
…
…
…
...
...
...
...
...
...
...
...
34
Netherlands Antilles
...
…
Latin America
Argentina
42,155
5-18
…
97
1.00
98
1.00
757
52
647
51
21
12
...
57
74
99
...
23
Bolivia, Plurinational State of
11,025
4,880
5-16
0.921
87
0.87
94
0.95
696
74
377
74
78
47
27
43
51
94
87
73
Brazil
203,657
11,530
6-14
…
89
1.00
91
1.01
15095
50
13,003
50
37
22
7
...
...
...
...
...
Chile
17,924
20,450
6-21
0.969
96
1.00
99
1.00
497
52
191
53
12
7
...
76
114
...
93
...
Colombia
49,529
9,990
5-15
0.902
93
1.00
94
1.00
2105
52
2,164
51
31
21
13
38
49
95
86
198
5,002
12,500
5-15
0.948
95
1.00
97
1.00
138
47
93
48
13
9
6
47
74
...
93
...
6-16
0.981
100
1.00
100
1.00
18
52
15
52
9
5
...
105
109
99
97
15
203
Costa Rica
...
Cuba
11,249
Dominican Republic
10,652
9,660
5-14
0.891
87
1.00
91
1.01
766
49
664
48
42
26
10
31
39
83
89
Ecuador
16,226
9,490
3-17
0.951
91
0.97
93
0.98
756
58
737
59
35
19
...
63
150
97
97
45
El Salvador
6,426
6,720
7-15
0.909
81
0.93
85
0.94
741
62
623
63
33
20
19
40
62
85
95
139
Guatemala
16,255
4,880
6-15
0.850
69
0.84
78
0.85
2047
62
1,937
67
53
28
48
46
64
84
95
286
Honduras
8,424
3,880
6-15
0.870
80
1.01
85
0.99
740
50
746
52
47
30
23
17
42
88
94
118
125,236
16,140
4-17
0.964
91
0.97
94
0.98
6662
61
4,953
62
29
16
14
70
101
98
98
284
Nicaragua
6,257
3,890
5-12
…
77
1.00
78
1.00
722
51
747
51
37
18
22
27
55
81
93
158
Panama
3,988
15,150
4-15
0.938
92
0.99
94
0.99
168
54
153
55
28
17
19
37
65
93
92
26
Paraguay
7,033
5,720
6-14
0.892
…
94
0.98
...
...
263
57
45
35
18
29
35
97
83
27
31,161
10,090
5-18
0.913
88
0.88
94
0.94
2270
73
1,318
76
48
23
18
56
78
100
96
3
3,430
15,310
4-17
0.969
97
1.01
98
1.01
78
44
42
44
18
13
15
60
89
...
100
...
31,293
12,920
5-14
0.956
93
0.99
96
1.00
1164
52
900
52
25
18
16
45
72
86
94
450
Sum
Median
Sum
%F
Sum
%F
Weighted
average
Mexico
Peru
Uruguay
Venezuela, Bolivarian Republic of
Latin America and the Caribbean
...
…
Weighted average
Median
Weighted
average
Weighted
average
Sum
625 207
10,610
...
…
90
0.98
92
0.99
38,488
55
33,030
55
36
21
...
54
74
93
94
18 287
11,300
...
…
72
0.96
69
0.96
2,826
54
3,457
54
78
50
...
...
...
74
71
583
606 920
9,990
...
…
90
0.98
93
0.99
35,662
56
29,573
55
34
20
18
55
76
94
95
3,416
Developed countries
1 040 886
35,195
...
…
…
…
…
…
...
…
…
…
7
6
...
75
88
98
96
1,427
Developing countries
5 944 265
4,820
...
…
77
0.84
80
0.87
775,715
64
771,717
64
82
67
29
27
49
82
90
102,930
World
7 291 097
8,370
...
…
82
0.89
84
0.91
786,523
64
780,682
64
75
49
25
33
54
84
91
105,769
Caribbean
Latin America
Sources: EFA Global Monitoring Report 2015, statistical and aid tables; UNESCO Institute for Statistics
database; CRS online database.
12
Note: See source tables in the EFA Global Monitoring Report 2015 for detailed country notes.
2. Data reflect the actual number of children not enrolled at all, derived from the age-specific or
adjusted net enrolment ratio (ANER) of primary school age children, which measures the proportion of
those who are enrolled either in primary or in secondary schools.
1. Data are for the most recent year available during the period specified.
3. Based on headcounts of pupils and teachers.
3,999
E D U C AT I O N F O R A L L G L O B A L M O N I T O R I N G R E P O R T 2 0 1 5 Primary education
Out-of-school
children2
L AT I N A M E R I C A A N D T H E C A R I B B E A N
Secondary education
GPI of GER
Total
Survival rate to
last grade
Pupil/teacher
ratio3
Education finance
GER
Lower secondary education
Upper secondary education
Total secondary education
Total
Total
Total
GPI
Total
GPI
Total
GPI
Total
GPI
Total
GPI
Total
GPI
(%)
(F/M)
(%)
(F/M)
(%)
(F/M)
(%)
(F/M)
(%)
(F/M)
(%)
(F/M)
(000)
(F/M)
(F/M)
(%)
(%)
2012
1999
2012
1999
2011
1999
2012
…
1999
2012
1999
REGIONAL OVERVIEW
2012
1999
2012
Total aid
disbursements
Total aid
to basic
Total public
Total aid
disbursements education per
expenditure on disbursements
to basic
primary school
education
to education
education
age child
(Constant 2012 (Constant 2012 (Constant
as % of GNP
US$ million) US$ million)
2012 US$)
1999
2012
2012
2012
2012
0.98
...
...
...
22
15
105
0.86
…
...
111
1.21
...
...
107
0.98
…
...
...
...
…
…
…
1.6
...
0.93
...
...
19
14
77
0.85
114
0.91
79
0.95
93
1.83
78
0.89
105
1.15
3.4
2.6
0
0
43
0.1
0.98
1.03
96
93
19
15
114
1.04
119
1.02
88
1.07
88
1.11
99
1.06
100
1.07
...
6.5
-
-
-
0.7
0.97
1.02
...
89
14
14
81
0.89
98
1.03
74
1.10
88
1.08
78
0.99
93
1.05
2.9
...
…
…
…
0.6
1.04
0.99
91
93
18
13
102
1.08
106
1.08
118
1.17
103
1.18
108
1.12
105
1.12
4.4
5.8
-
-
-
0.4
0.96
0.97
74
91
23
22
74
1.03
96
1.02
44
1.23
60
1.15
64
1.07
84
1.05
5.7
7.1
3
2
56
0.6
1.01
0.98
87
...
9
9
89
1.09
85
1.16
71
1.04
72
1.19
79
1.07
77
1.18
...
2.1
…
…
…
0.5
0.97
0.92
...
...
18
12
110
0.85
110
0.91
81
1.05
79
1.25
99
0.91
97
1.01
...
4.8
…
…
…
…
0.91
...
92
...
15
12
98
0.97
…
...
92
0.87
...
...
95
0.92
…
...
...
...
…
…
…
…
...
...
...
...
...
...
…
...
…
...
…
...
...
...
…
…
…
...
...
...
…
…
…
0.3
1.02
0.97
79
88
20
16
126
1.30
106
1.01
63
1.45
84
1.18
101
1.33
97
1.07
5.5
...
1
0
105
…
0.97
0.97
...
...
20
16
…
...
121
0.94
…
...
89
1.25
…
…
108
1.03
...
...
0
0
33
32
1.01
1.13
65
92
27
23
92
1.13
104
1.13
68
0.79
96
1.20
83
1.01
101
1.15
9.3
3.2
3
2
25
…
...
...
...
...
...
...
…
...
…
...
…
...
...
...
…
…
…
...
...
...
94
54
66
…
1.00
...
85
82
...
23
97
0.98
88
1.00
74
1.06
89
1.15
88
1.01
89
1.06
5.2
6.4
11
5
…
…
0.99
...
...
...
21
...
171
0.70
…
...
204
0.82
...
...
183
0.75
…
...
...
5.4
…
…
…
1.1
1.04
1.01
74
74
19
15
116
1.06
99
0.99
89
1.19
87
1.14
105
1.10
94
1.04
4.9
...
4
2
596
4
0.95
0.97
...
90
24
17
73
1.29
91
0.94
68
1.21
91
1.05
71
1.26
91
0.99
7.7
4.2
4
2
202
…
...
...
...
...
...
...
…
...
…
...
…
...
...
...
…
…
…
...
...
...
…
…
…
0.95
0.96
...
69
20
16
97
1.29
110
0.87
61
1.47
88
1.16
83
1.34
101
0.96
7.2
5.3
6
3
487
0.1
…
...
...
...
...
...
...
…
...
…
...
…
...
...
...
…
…
…
...
...
...
…
…
…
5
0.99
0.96
...
...
20
15
80
1.03
90
1.10
61
1.71
79
1.80
73
1.19
85
1.31
...
...
2
0
40
2
0.99
0.97
89
89
21
...
82
1.07
…
...
…
...
...
...
…
…
…
…
2.9
...
-
-
-
…
...
...
...
...
18
...
…
...
…
...
…
...
...
...
…
…
…
…
...
...
…
…
…
…
...
...
...
...
20
...
…
...
…
...
…
...
...
...
…
…
…
…
...
...
…
…
…
…
0.99
0.99
89
93
21
...
100
1.02
114
1.03
69
1.10
70
1.24
85
1.05
92
1.11
4.6
6.4
37
13
9
194
0.98
0.98
80
86
25
...
90
0.98
91
0.97
68
0.90
70
1.02
76
0.93
77
1.00
5.8
7.2
52
20
35
…
...
...
80
54
26
21
...
…
...
...
...
...
...
...
...
109
0.97
0.97
98
99
32
21
87
…
1.00
98
1.00
75
1.06
85
1.05
79
1.04
599
1.00
0.97
67
85
24
25
80
1.08
101
1.05
58
1.18
76
1.21
73
33
0.99
0.99
89
88
27
17
75
1.07
121
0.99
42
1.18
79
1.20
62
28
0.97
0.99
95
96
12
9
100
0.99
100
0.98
57
1.21
81
1.04
137
0.98
0.91
71
79
31
24
61
1.16
84
1.04
53
1.29
72
59
1.00
1.00
75
91
23
18
65
0.97
96
0.97
52
1.10
41
0.96
0.96
62
84
...
29
66
0.97
90
0.99
38
0.98
110
0.87
0.97
52
71
38
26
36
0.80
71
0.88
29
67
1.01
1.00
...
70
32
...
...
75
1.14
291
0.94
1.00
87
96
27
28
90
0.99
109
54
1.01
0.98
46
...
34
30
58
1.14
…
...
4.0
5.9
131
21
…
89
…
1.04
4.0
4.7
28
7
19
1.11
93
1.09
4.5
4.6
64
16
15
1.10
104
1.05
5.5
6.5
11
4
24
79
1.06
90
1.00
6.9
13.0
7
1
8
1.17
56
1.24
76
1.12
2.0
...
33
19
26
77
1.08
59
1.03
87
1.02
1.7
4.4
45
19
24
48
1.04
52
0.97
69
1.00
2.4
3.5
30
13
39
0.91
56
0.98
33
0.84
65
0.91
...
3.1
31
19
13
...
...
71
1.36
...
...
73
1.22
...
...
45
35
40
1.11
44
1.02
62
1.04
68
1.00
86
1.08
3.7
5.3
59
9
4
79
1.05
41
1.30
54
1.23
51
1.18
69
1.10
3.0
4.7
27
18
35
35
0.97
0.97
90
92
26
23
77
1.02
89
1.01
50
1.19
79
1.11
64
1.08
84
1.05
5.1
3.7
4
2
10
150
0.96
0.96
73
80
...
22
71
1.01
80
1.03
44
1.08
59
1.08
58
1.04
70
1.05
4.9
5.0
15
11
18
129
0.99
0.99
83
74
29
19
90
0.93
100
0.94
70
0.97
74
1.01
83
0.94
90
0.96
3.4
2.9
47
18
13
0.99
0.97
87
95
20
14
104
1.07
110
1.07
80
1.32
71
1.26
92
1.17
90
1.14
2.4
4.7
6
2
19
0.98
0.98
88
94
...
...
67
1.17
92
1.05
41
1.38
76
1.18
57
1.22
85
1.09
...
6.9
16
3
5
0.5
191
Sum
Weighted
average
Weighted
average
Median
Weighted average
Weighted average
Weighted average
Median
Weighted
average
Sum
3,763
0.96
0.97
77
77
26
21
95
1.03
98
1.03
63
1.14
76
1.14
80
1.07
88
1.07
4.5
4.9
868
330
7
650
0.98
0.99
43
...
29
...
65
1.00
73
1.05
34
0.98
47
1.09
50
0.99
60
1.06
…
…
…
…
…
3,113
0.96
0.97
78
79
26
21
95
1.03
99
1.03
64
1.14
77
1.14
81
1.07
89
1.07
4.0
4.7
…
…
…
2,347
1.01
0.99
93
94
16
14
101
0.99
103
0.99
97
1.04
100
0.99
99
1.02
101
0.99
5.0
5.4
…
…
…
54,876
0.91
0.97
72
72
29
26
65
0.89
82
0.97
37
0.86
56
0.95
51
0.88
69
0.96
4.4
4.7
…
…
…
57,788
0.92
0.97
75
75
26
24
71
0.92
85
0.98
45
0.91
62
0.96
59
0.91
73
0.97
4.5
5.0
12,584
5,079
8
13
REGIONAL OVERVIEW
L AT I N A M E R I C A A N D T H E C A R I B B E A N
E D U C AT I O N F O R A L L G L O B A L M O N I T O R I N G R E P O R T 2 0 1 5
Abbreviations
ANER: adjusted net enrolment ratio. ANER measures
the proportion of children of primary school age who are
enrolled either in primary or in secondary schools.
ECCE: early childhood care and education. ECCE are
programmes that, in addition to providing children with
care, offer a structured and purposeful set of learning
activities either in a formal institution (pre‑primary or
ISCED 0) or as part of a non‑formal child development
programme. ECCE programmes are usually designed
for children from age 3 and include organized learning
activities that constitute, on average, the equivalent of at
least 2 hours per day and 100 days per year.
EFA Development Index (EDI). EDI is a composite index
aimed at measuring overall progress towards EFA. At
present, the EDI incorporates four of the six EFA goals —
universal primary education, adult literacy, gender parity
and equality, and education quality – each with a proxy
indicator. The index value is the arithmetic mean of the
four indicators and ranges from 0 to 1.
GER: gross enrolment ratio. GER is the total enrolment in
a specific level of education, regardless of age, expressed
as a percentage of the population in the official age group
corresponding to this level of education. For the tertiary
level, the population used is that of the five-year age
group older than the secondary school leaving age. The
GER can exceed 100% due to late entry and/or repetition.
GNP: gross national product. GNP is the gross domestic
product plus net receipts of income from abroad. As
4. Values for total aid disbursements to education and to basic education for regional and other country
groups do not always sum up to world totals because some aid is not allocated by region or country.
(-) Magnitude nil or negligible
14
these receipts may be positive or negative, GNP may be
greater or smaller than GDP. This latter indicator is the
sum of gross value added by all resident producers in the
economy, including distributive trades and transport, plus
any product taxes and minus any subsidies not included
in the value of the products.
GPI: gender parity index. GPI is the ratio of female to
male values of a given indicator. A GPI between 0.97 and
1.03 indicates parity between the genders. A GPI below
0.97 indicates a disparity in favour of males. A GPI above
1.03 indicates a disparity in favour of females.
PIRLS: Progress in Reading Literacy Study.
PPP: Purchase parity power. An exchange rate
adjustment that accounts for price differences between
countries, allowing international comparisons of real
out and income.
PTR: pupil/teacher ratio. Average number of pupils
per teacher at a specific level of education, based on
headcounts for both pupils and teachers.
SERCE: Second Regional Comparative and
Explanatory Study.
TERCE: Third Regional Comparative and
Explanatory Study.
TIMSS: Trends in International Mathematics and
Science Study.
(.) The category is not applicable or does not exist.
(…) No data available.
E D U C AT I O N F O R A L L G L O B A L M O N I T O R I N G R E P O R T 2 0 1 5 L AT I N A M E R I C A A N D T H E C A R I B B E A N
REGIONAL OVERVIEW
15
United Nations
Educational, Scientific and
Cultural Organization
Regional Overview:
Latin America and the Caribbean
e-mail: [email protected]
Tel.: +33 1 45 68 09 52
Fax: +33 1 45 68 56 41
www.efareport.unesco.org
Download